Run progress UI
Clay provides multiple ways to track and monitor run progress across your tables.
Clay provides multiple ways to track and monitor run progress across your tables. These tools help you confirm that columns are executing correctly, data remains current, and issues are quickly identified.
Column progress bar
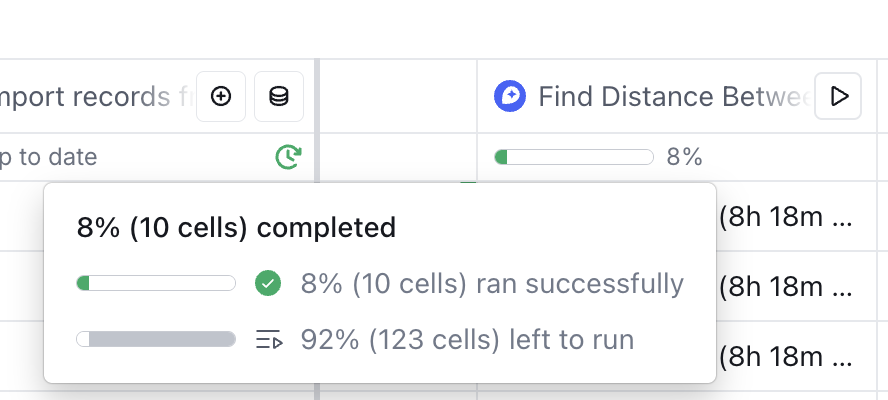
The progress bar gives you a snapshot of a column's current state. It shows:
- Whether the column is actively running
- The percentage of all rows in the table that have run (including rows not currently visible)
- A breakdown of rows by status:
- 🟢
Successful— The cell completed successfully.- Note: "Run condition not met" is also treated as a successful run
- ⚪
Running— The cell is in progress or queued. - 🔴
Failed— The cell ran but encountered an error, such as:- Missing required inputs
- Format/type errors
- Cell size limit exceeded
- Run timeout
- Other unexpected issues
- 🟢

Hovering over the progress bar displays a detailed status breakdown. This includes all rows in the table, even if filters or row limits are applied.
Formula & Derived Columns — These calculate instantly. They don't display "Running" status or partial completion percentages. Instead, they appear with a ✅ once ready.
Waterfall Columns — The progress bar shows the overall percentage of all waterfall cells that have run.
For Sources and Signals, the status displayed depends on the update state:
Updating…— Actively refreshingWaiting for events…— Monitoring for new events (applies to Signals + Webhooks only)Up to date— Fully refreshed with the latest data
Run indicators
Several icons can appear on the right side of the cell to indicate specific column statuses:
- ⏯️ icon: The user has turned auto-update off for this column.
- Green timer icon: This column runs automatically on a periodic schedule.
- Hover over the icon to see the frequency ("daily", etc.).
- ⌨️ icon: Basic column types with no formulas or input tokens are distinguished by this "manual entry" icon.
Table-level progress
.png)
The table-level progress bar, shown at the bottom right of a table, provides a summary view of the entire table’s run status. It displays:
- The percentage of all enrichment cells in the table that have run.
- Note: Includes non-visible rows, but not non-visible columns.
- The percentage of rows by status (same definitions as at the column level).
- Whether any column in the table is currently running.
- Run summary panel — Hovering over the panel reveals:
- A detailed breakdown of status percentages.
- Table-level auto-run and scheduled run settings.
- A toggle to enable/disable column-level run status data.


