

Clay is a go-to-market platform: sales and marketing teams use it to find people and companies, and enrich them with datapoints like job titles, locations, and past experiences. Behind that sits CPJ, a structured dataset of more than a billion Company, People, and Job records, each a nested document with as many as ~165 fields.
For a long time, we couldn't answer simple questions about our own data:
- What percentage of people have a job title?
- How often does a record gets updated?
- Is our coverage improving over time?
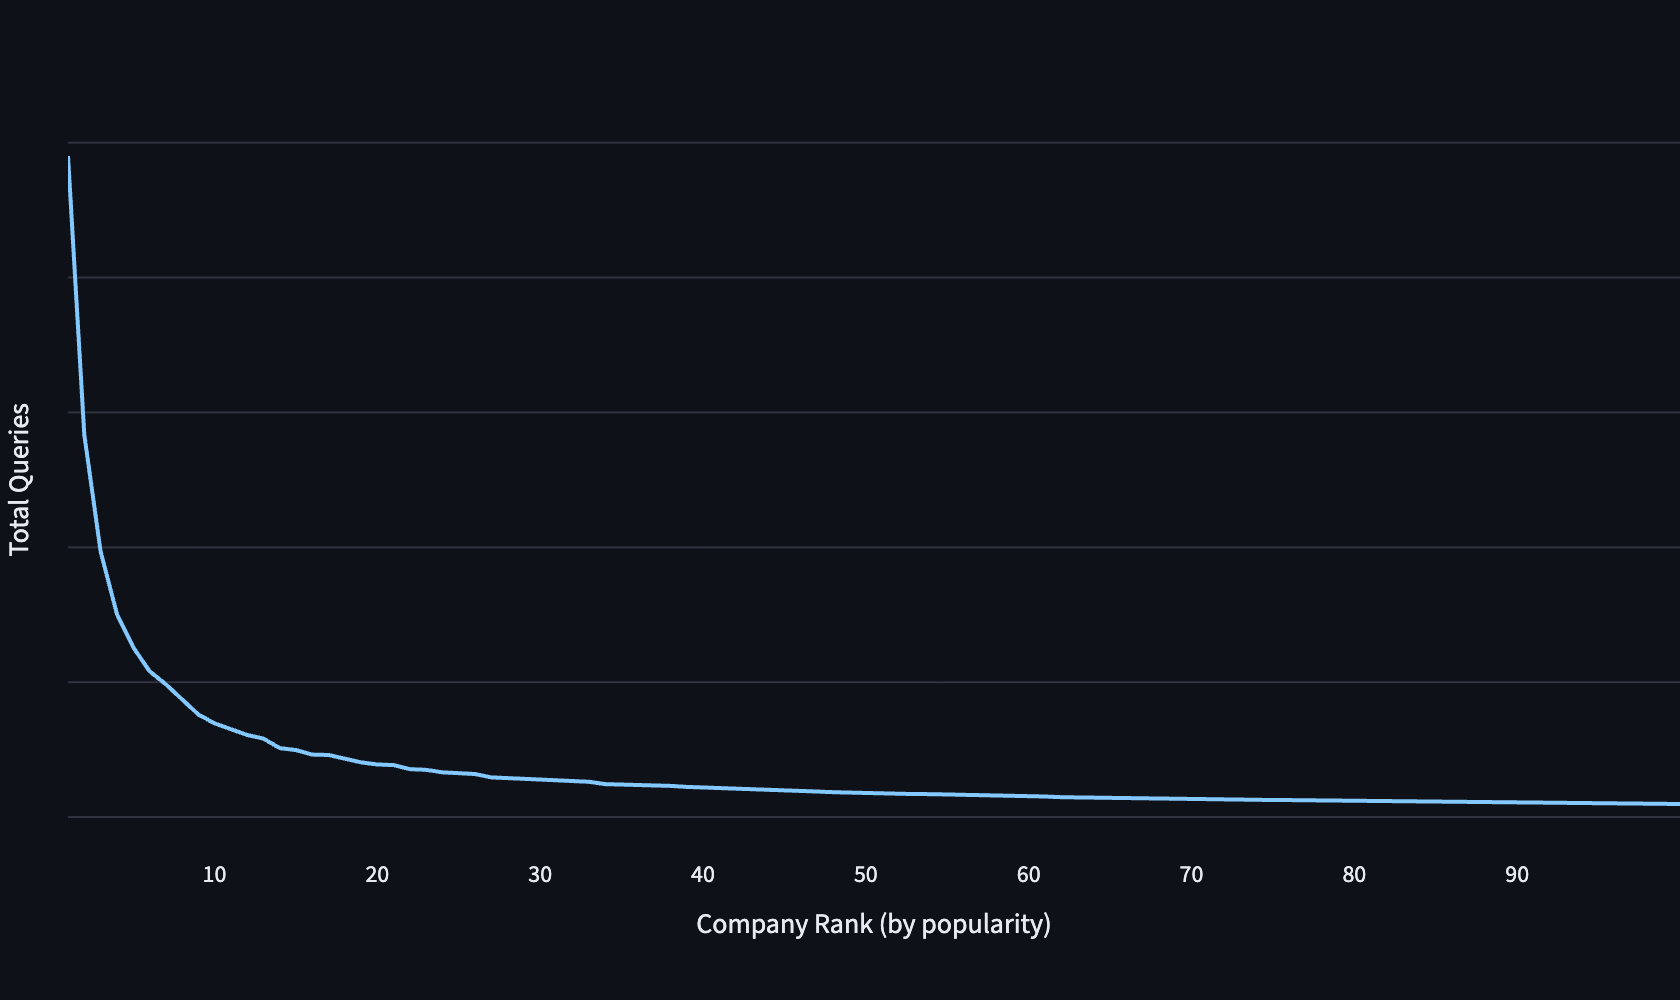
- What are our most popular records?
Without these insights, it was very difficult to determine when data regressions started, or their scope. We would often resort to running bespoke queries on restored database snapshots.
CPJ Visibility is the data quality system we built to improve our lives, and save countless hours.
What does data quality mean, exactly?
We define and measure CPJ quality through 5 metrics, bucketed into two groups.
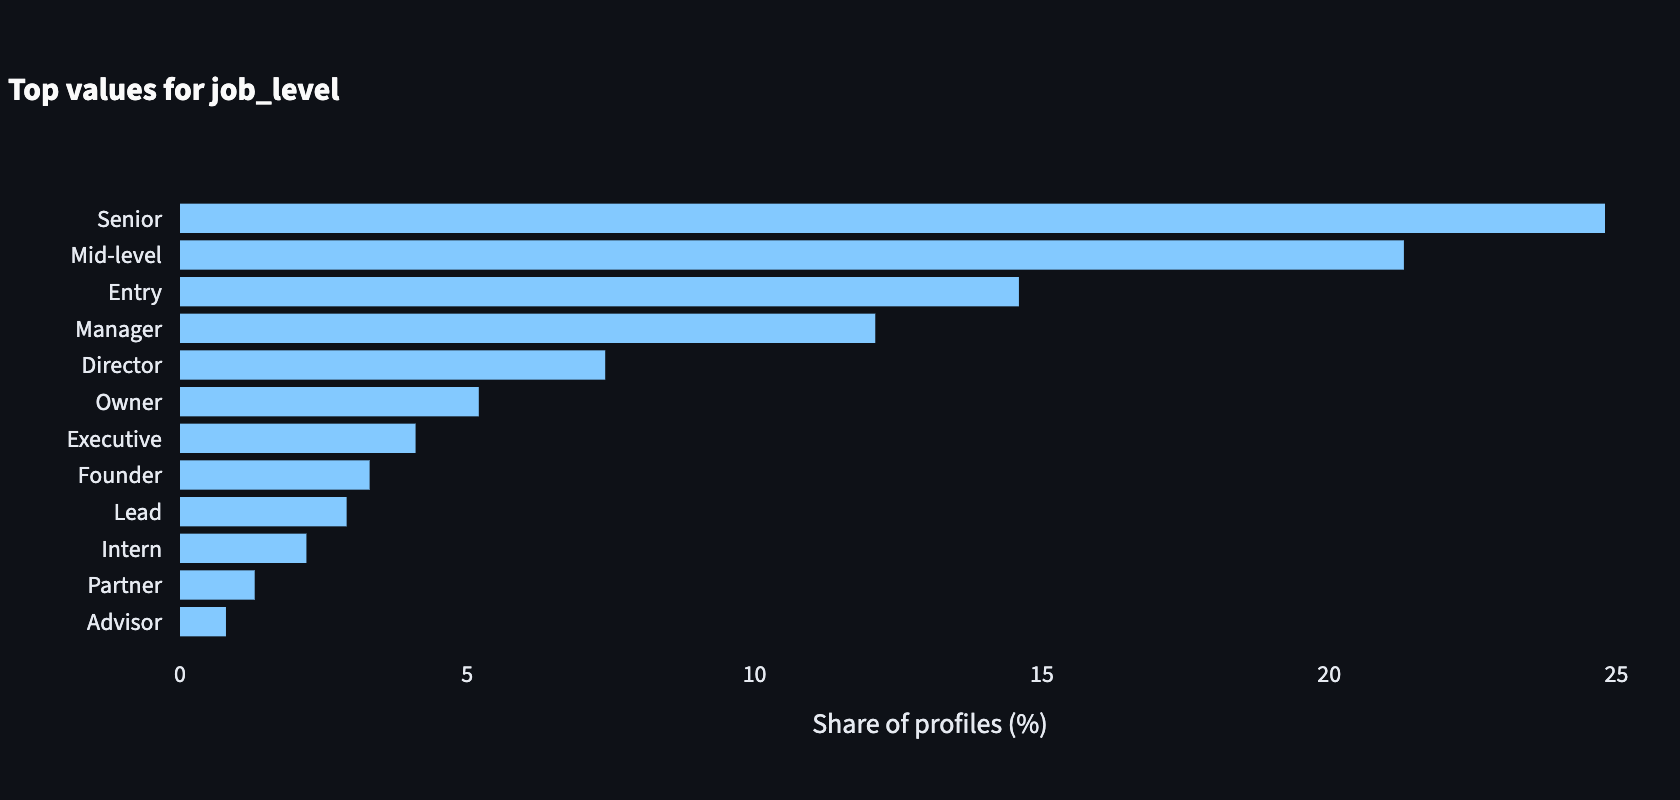
- Quality metrics describe the dataset itself, and what it contains. This includes Coverage, Freshness, Lineage, and Value distributions.
- Usage metrics report how our dataset is used by customers, and which records are most popular.

These metrics are computed regularly to establish a baseline for data quality, and detect regressions.
Two pipelines, one view of quality
Computing the metrics is done via two pipelines, one for each metric group.
At the end of the pipelines, we combine the data to help answer multidimensional queries like “How often is our profile education data updated, for our top 10% most popular profiles in EMEA?”
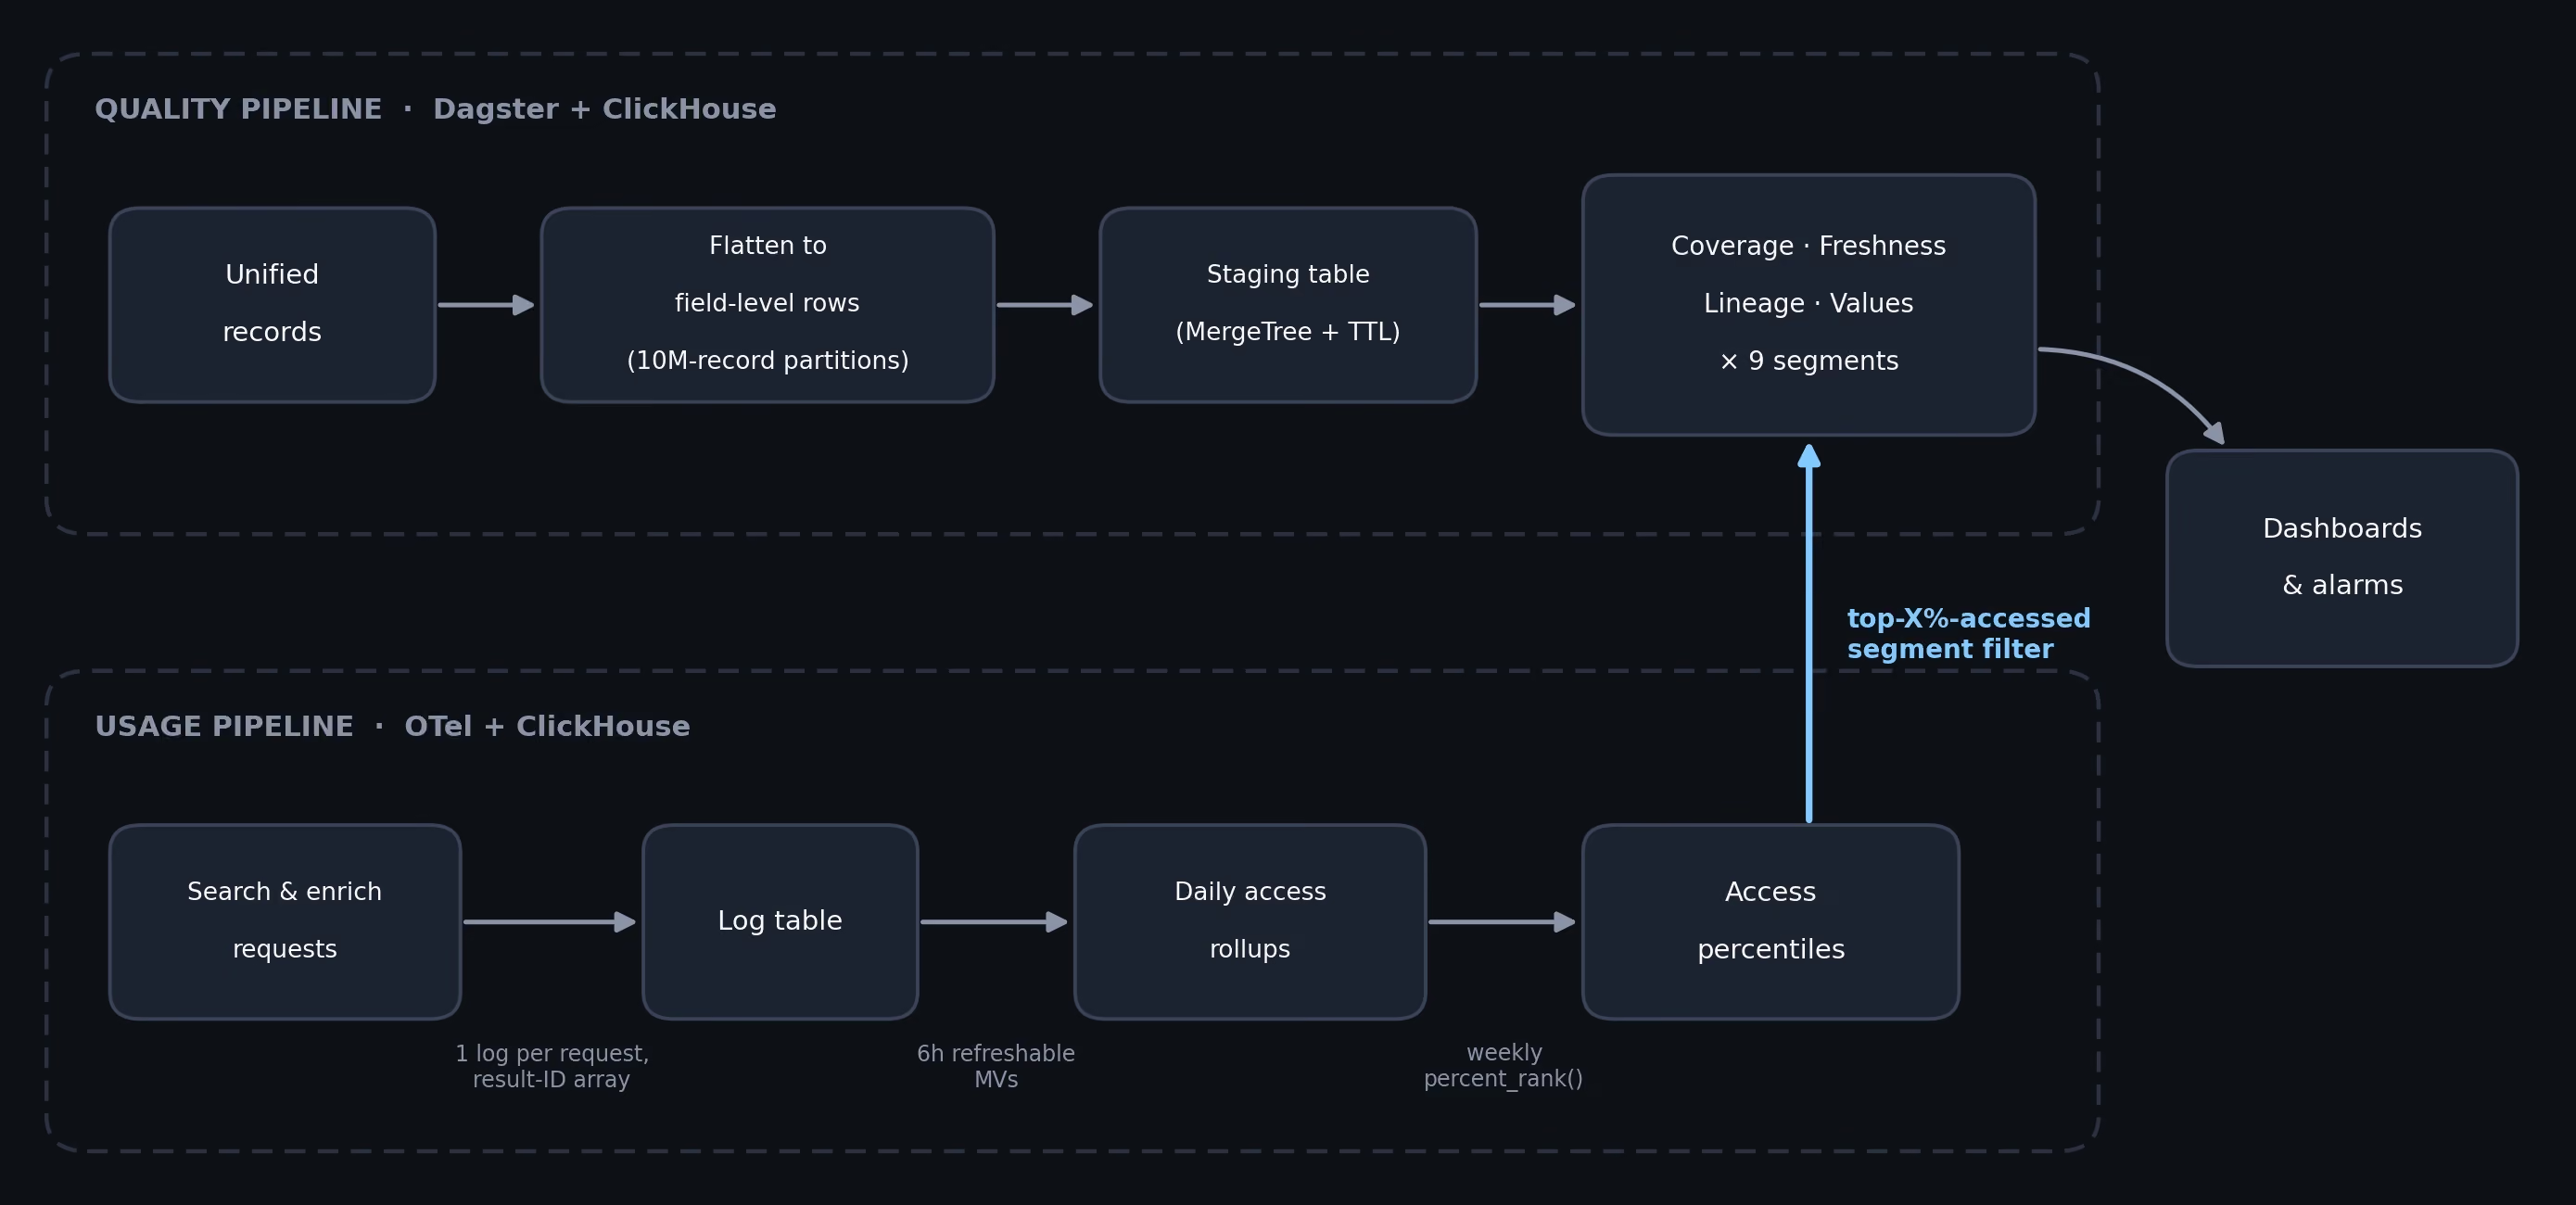
Two design choices in this diagram:
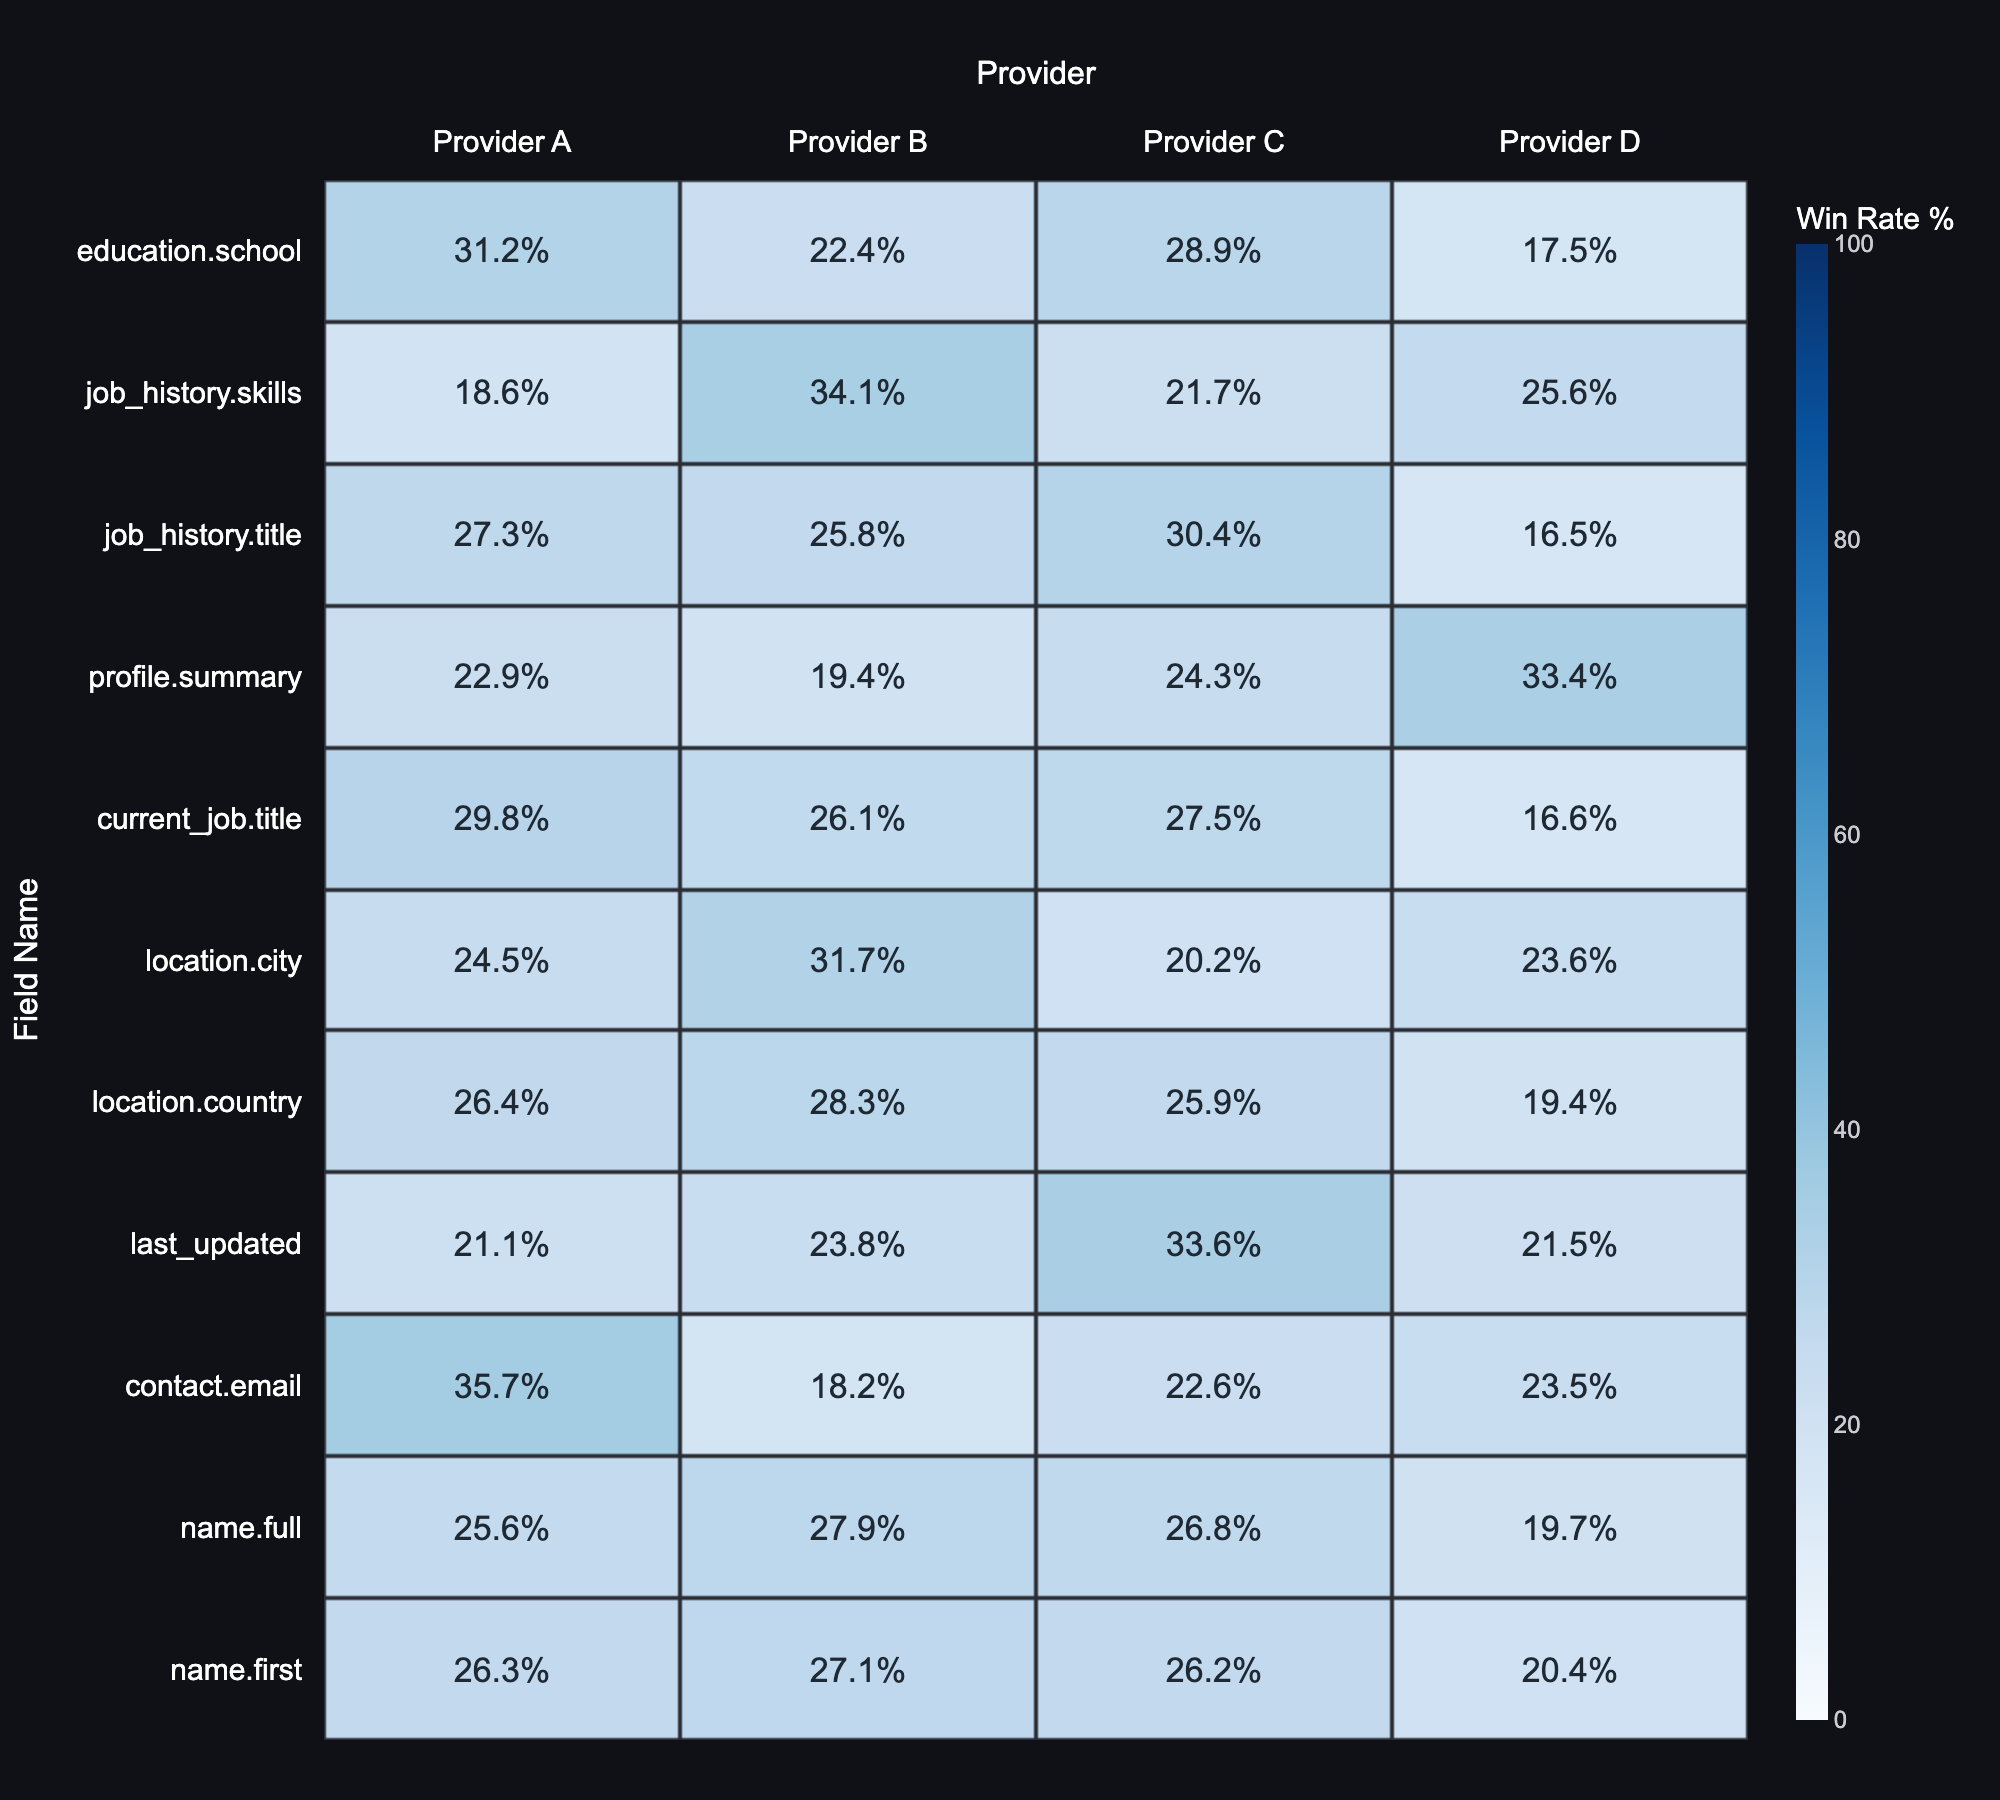
- Capture lineage at merge time: One of the final steps in our ingestion pipeline is the merger, which combines data from several providers into a single CPJ entity. That’s where we record lineage (which provider record each field came from).
- Detect daily, describe weekly: Daily deltas are fast enough to catch regressions, but they’re biased toward frequently updated records. Weekly snapshots are expensive, but they reflect the dataset customers can retrieve right now. We use one to detect change and the other to establish a baseline.
We use ClickHouse as both the compute engine and the storage layer. An OLAP database fits our offline analysis pattern well, since aggregation is exactly what a columnar database is good at. ClickHouse's storage layer is also cheap and scales easily, allowing us to create giant intermediate tables and throw them away later.
The OpenTelemetry collector-to-ClickHouse integration is mature as well, and lets us collect logs to analyze query patterns and popularity of our records.
The quality pipeline: counting billions of rows
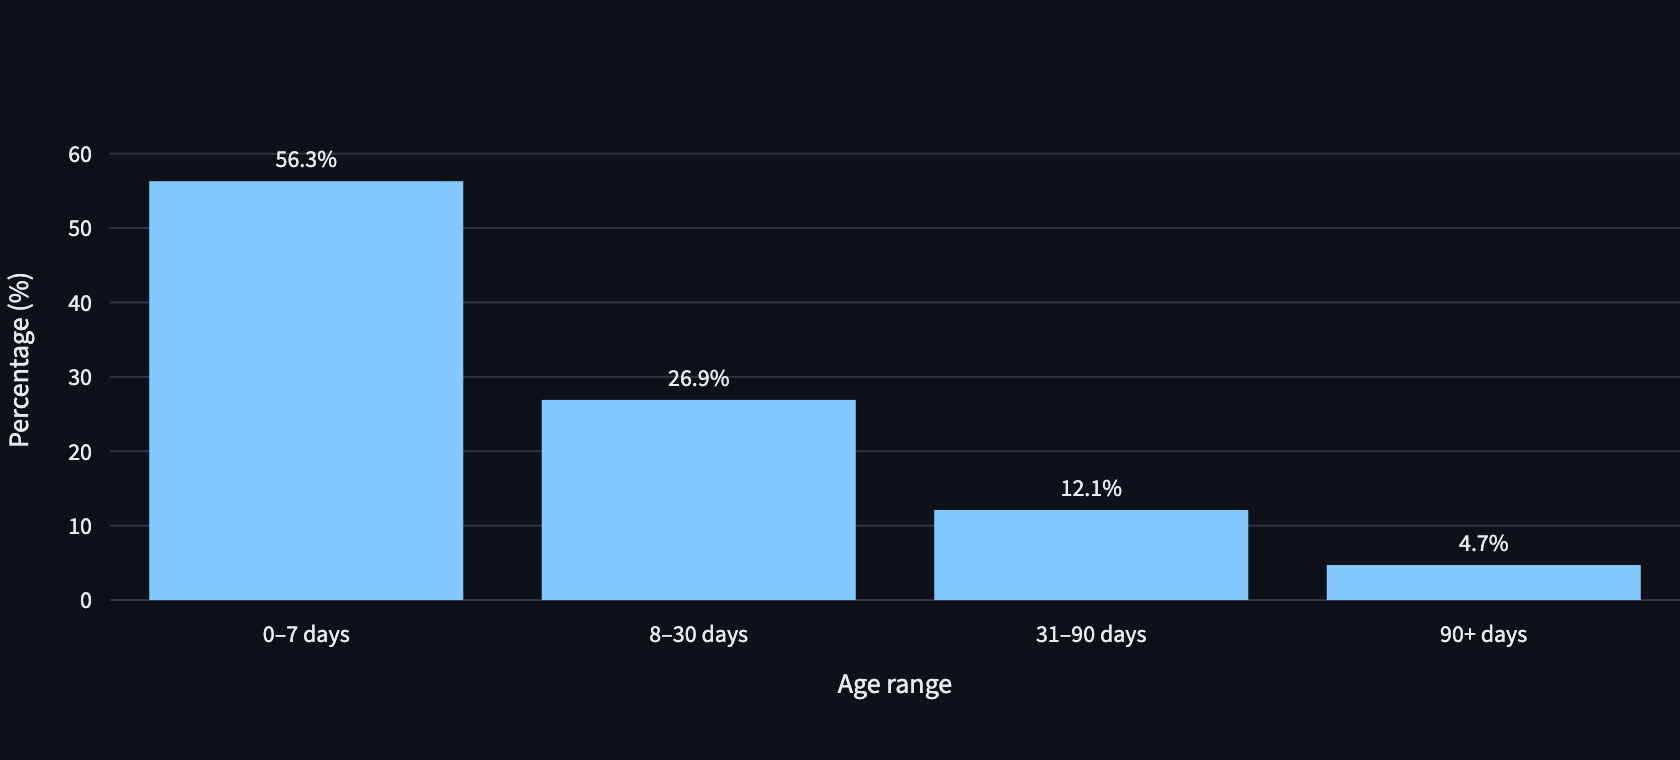
We have a weekly snapshot job that essentially flattens 57 billion rows, with ~165 fields into a tall table of (record_id, field_name, value, provider, country, age). These last three columns let us slice metrics by country, provider, and record age.
This job takes ~13 hours to complete, and our main engineering challenge was making this job robust. A query that runs that long could fail for a variety of reasons: hitting a bad record, out of memory, transient outage, etc.
Partitioning our work
Our solution was to split our rows into multiple partitions, which could be processed and retried independently. ClickHouse natively supports partitions, which made this much easier.
Each flatten task reads one partition of 10M ids, then writes records to a staging table partitioned by that same key, with a 14-day TTL for cleanup. INSERT SELECT isn't transactional, so a killed task leaves partial rows behind. But because a task owns exactly one partition, the retry needs no dedupe logic at all:
if context.retry_number > 0:
    clickhouse.command(f"ALTER TABLE {staging} DROP PARTITION {id_start}")
DROP PARTITION is metadata-only, so recovery is instant. Failures now only cost one 10M-record slice, not the entire 13 hours of progress. And because the staged rows persist, the aggregation phase can be rerun or changed without paying the flatten again!
Just pay the $100
A natural thought when looking at our weekly 13-hour job was: is there anything we could optimize? We did consider some alternatives, like only calculating stats on the delta and adding to last week’s snapshot.
However, when a full re-computation only costs $100, the clever incremental system wasn’t worth its maintenance overhead. Spending the extra money to recompute it from scratch every week is worth the peace of mind!
The usage pipeline: knowing what customers actually use
To understand how customers use Clay and what records they actually use, we instrumented our surfaces to emit OpenTelemetry logs capturing which CPJ records were accessed, which filters were used, and from where.
These logs flow to a ClickHouse raw logs table, where a refreshable materialized view unrolls the ID arrays and aggregates to daily rollups per record (record_id, day, source, query_volume).
A separate weekly job processes these rollups to compute percentile ranks by query volume, producing an access_percentile_last_7d table that ranks every CPJ record by popularity.
Because our rollup tables grew too large, our internal dashboards display (accurate) approximations for speed, computed with ClickHouse row sampling. But sampling the rollup tables directly means that a row with query_volume=10000 is just as likely to be dropped as a row with query_volume=1. We fixed this by exploding each rollup into ≤4-query buckets with a hashed sample key, so row sampling better approximates traffic sampling.
Where the two halves meet
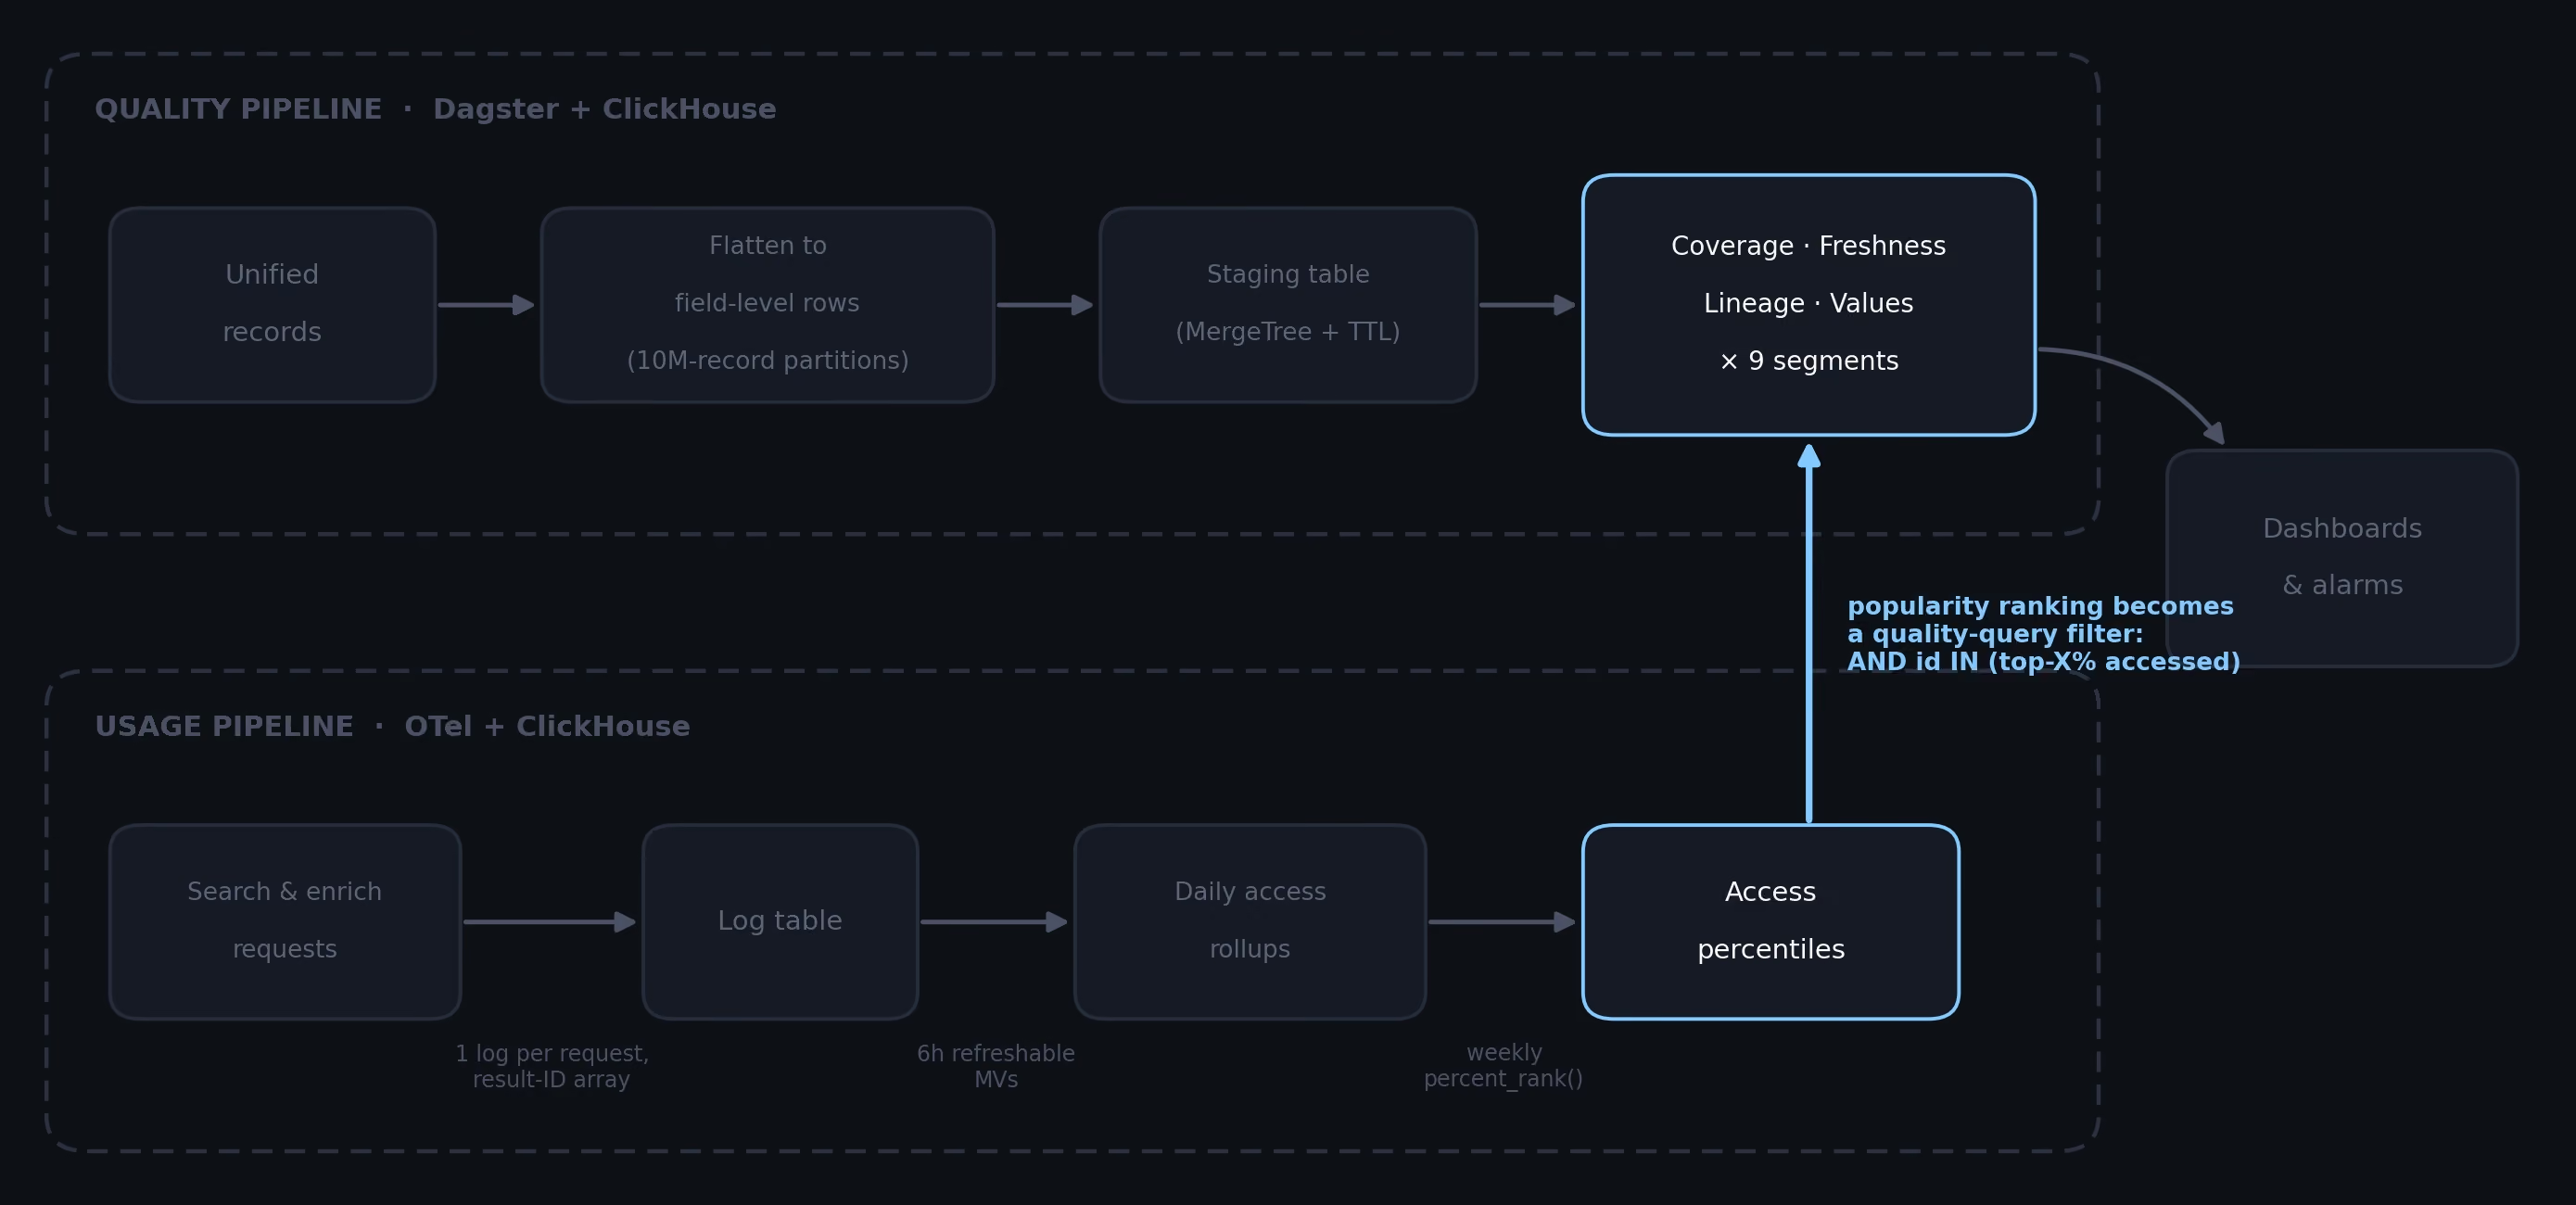
The outputs from the two pipelines can be combined to answer extremely granular queries about our data. The weekly percentile table can be used as a filter predicate on quality queries, letting us answer questions like "What is the location value distribution for our top 5% most popular companies accessed via Clay enrichment actions?"
-- the "accessed_top5pct" segment is one extra predicate on the metric queries:
AND id IN (
    SELECT id FROM access_percentile_last_7d
    WHERE window_start = (SELECT max(window_start) FROM access_percentile_last_7d)
      AND percentile >= 0.95
)
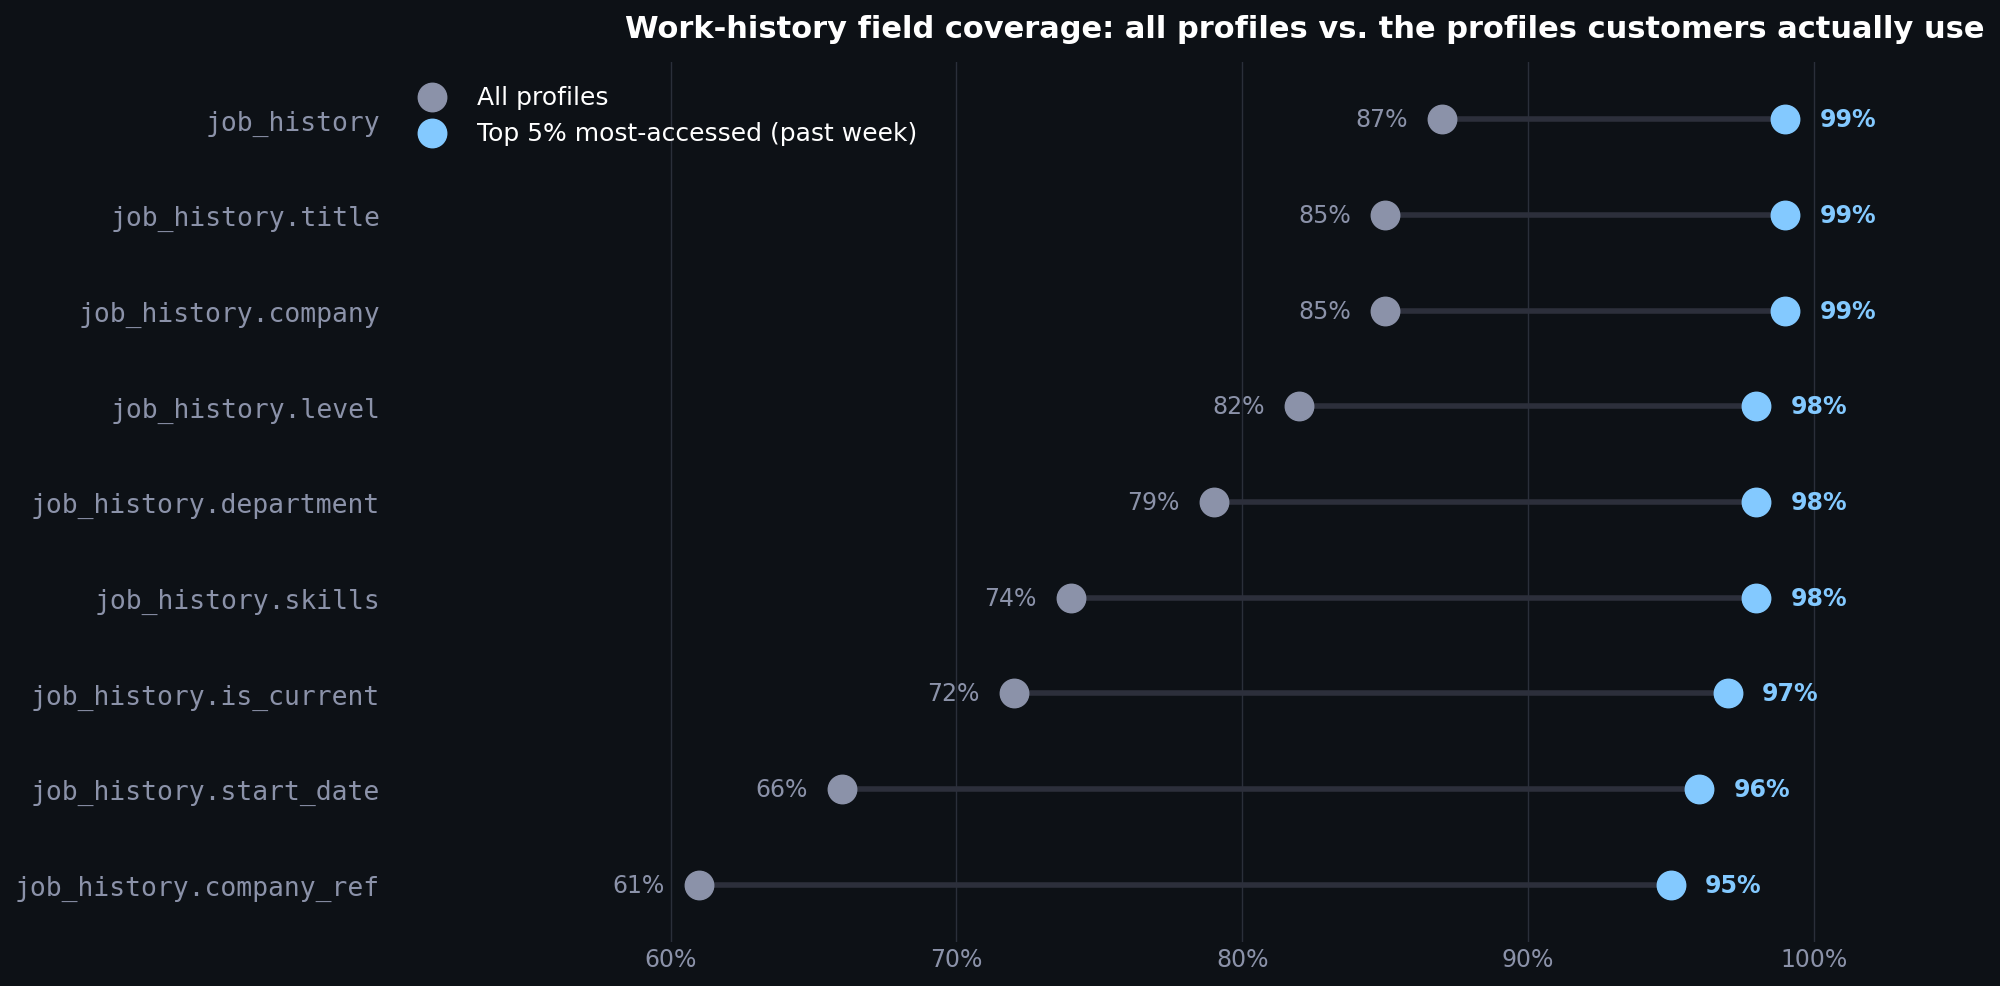
This is the real payoff: in the diagram below, we see that
- 69% of profiles specify work-experience skills
- but 99% of the top 5% most popular profiles specify them
With global coverage varying by region, knowing which records customers care about allows us to focus on quality improvements where they matter most.
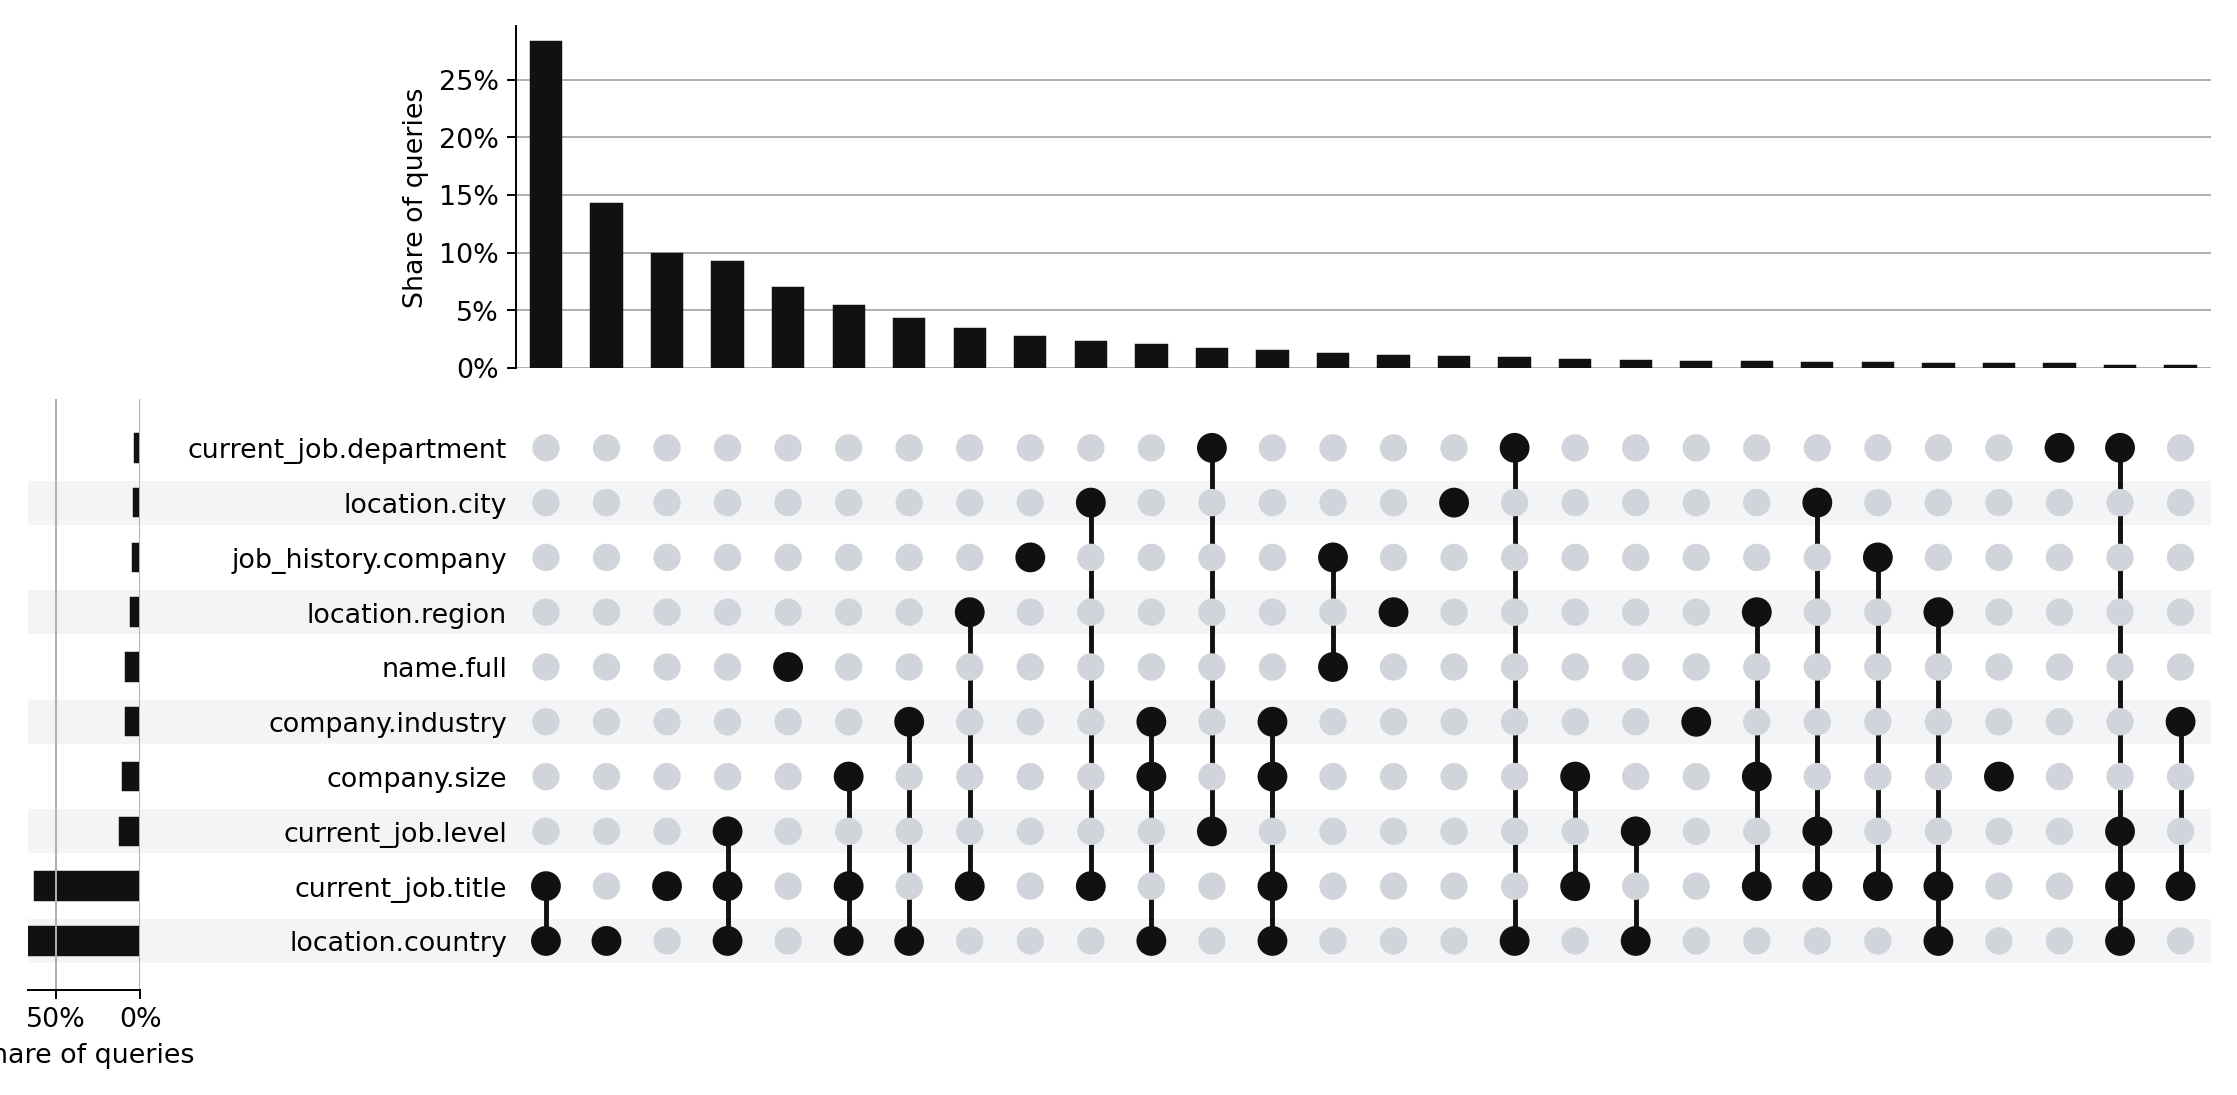
The same usage logs also reveal which fields customers tend to filter on. A weekly job counts which filter fields appear together in real queries and renders the result as an UpSet plot. A field that shows up in most searches gets held to a different quality bar than one nobody filters on.
What's changed
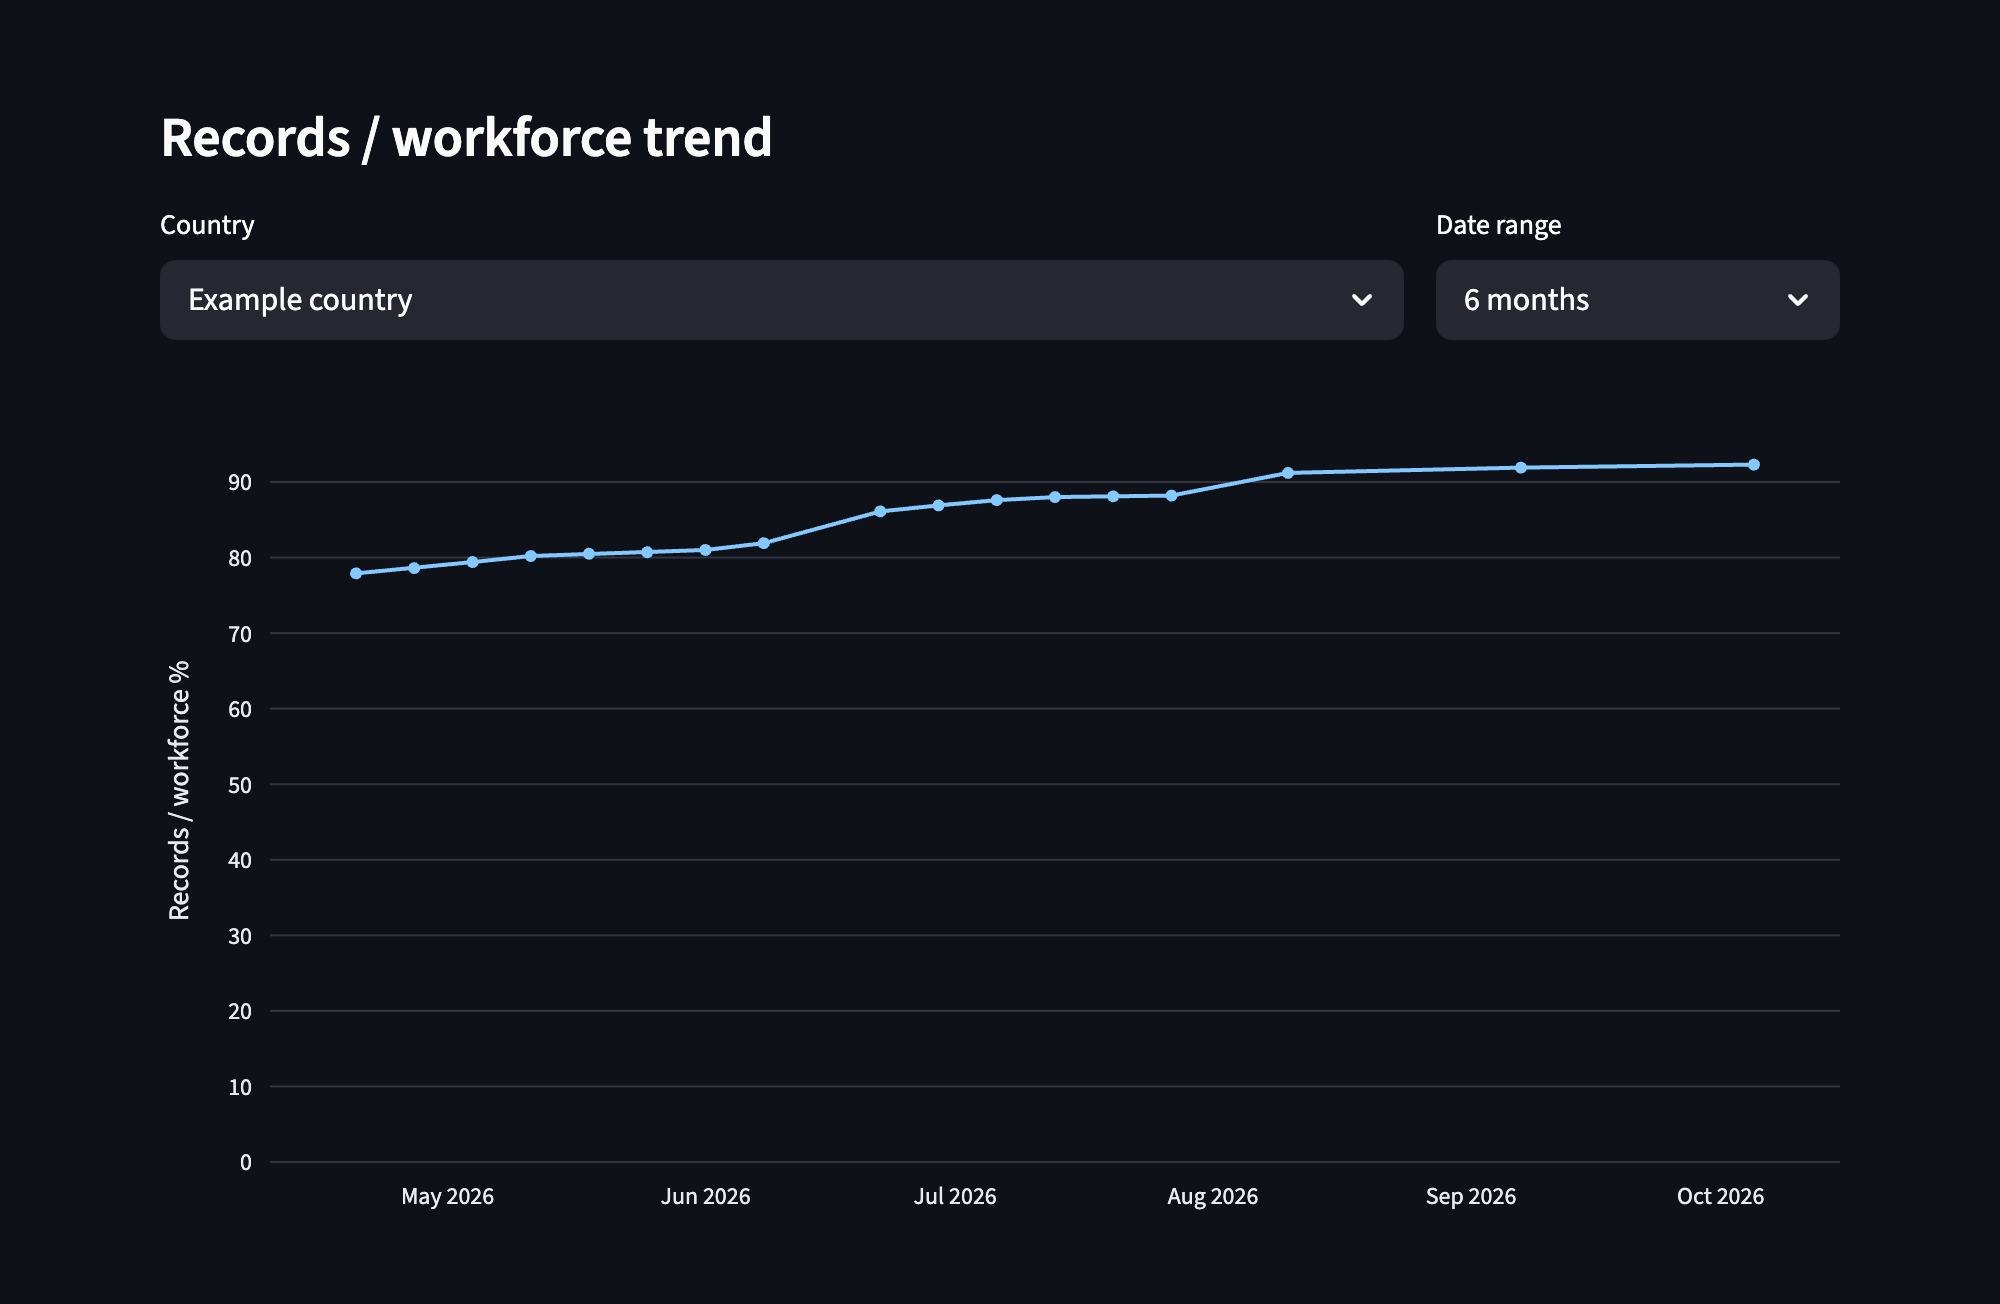
Everyone at Clay now has easy access to the data quality of CPJ. The coverage history that took days of snapshot restores last year now loads in a couple of seconds! We've also built up alerts to stay on top of data regressions.
Beyond internal visibility, CPJ Visibility unlocks real business value. We can confidently tell customers that our data is fresher than competitors, because we have the metrics to back it up. The usage data guides where we invest in new data sources: prioritizing countries, regions, and fields where customers actually need better coverage. And by learning which records get queried most, we're building toward a system that keeps improving the data customers care about.
If these sorts of data challenges sound interesting to you, we're hiring across our engineering team - please reach out!